A person’s access to physicians and other healthcare providers is critical to meeting their healthcare needs. The availability of healthcare professionals varies widely across the U.S., resulting in disparities in healthcare access for different populations. Racial prevalence also varies significantly across the U.S. In this paper, we evaluate how provider access is correlated with racial makeup by measuring provider access by county compared to racial makeup by county. Lower provider access may lead to unmet healthcare needs, so understanding how raw access varies by racial group nationwide can help highlight healthcare disparities.
The question of access to physicians and other healthcare providers has been analyzed across academic analyses, government reports, insurer network requirements, and actuarial publications. Different versions propose different metrics for evaluating whether a given area or population has sufficient provider access to meet its healthcare needs. One important evaluation metric measures whether physicians are distributed equitably across different areas of the country so as not to disadvantage some racial or ethnic groups. For this analysis, we used the Area Health Resource Files (AHRF),1 produced by the Health Resources and Services Administration (HRSA),2 paired with an enhanced two-step floating catchment area (E2SFCA) methodology based on county population and size.3 E2SFCA is a technique used to address distance-related accessibility drop-off and demonstrates that some material gaps and variation in provider access exist across different self-reported racial backgrounds.
The distribution of the U.S. population by self-reported race varies significantly across the country, so evaluating access by race can be complicated. Although some analyses attempt to distinguish provider access at the neighborhood level, in this report we reviewed provider access at the county level as a middle level of complexity with reasonable credibility. By using the E2SFCA framework, we can account for provider accessibility based on a measure of difficulty of access to evaluate the baseline level of access for different populations.
Background: What factors affect patient access to healthcare professionals?
The U.S. is experiencing a shortage of healthcare professionals at almost every level, including by provider specialty,4 in rural and urban regions,5 and across other characteristics. This shortage is not new and, by many accounts, is worsening.6 In this paper, we evaluate the relative mix of provider accessibility by specialty at the county level, assuming that potential patients primarily access healthcare services in person in their home county or a neighboring county. For this analysis, provider accessibility is measured as the ratio of provider count to population within a county, with adjustments for estimated travel distance to the provider. To account for the added difficulty of reaching a more remote professional, we adjust the ratios according to an E2SFCA methodology, effectively reducing the available professionals by the size of the home and neighboring counties. Although this is an imperfect proxy for measuring actual travel time, it produces a more nuanced consideration of access within broader regions beyond simple provider ratios. It is also important to keep in mind that the measure of access here is a raw metric, which could be further restricted by availability and type of healthcare coverage (e.g., Medicare, Medicaid), income level, and other features not measured here. Further, more recent telehealth options open up additional access possibilities for some types of care, though we do not address telehealth access here.
How does racial distribution affect access to healthcare providers?
Race is distributed unevenly across the U.S. due to many complicated historical and existing factors, and understanding the causes behind differing regional racial makeup is beyond the scope of this paper. Instead, this paper focuses on analyzing how access to healthcare providers varies by race due to differences in the combination of region and race. Figure 1 summarizes the AHRF-reported county (or county equivalent) makeup by county type as defined by the Core Based Statistical Area (CBSA) framework of metropolitan areas, separated between metro central (the most urban) and metro outlying areas, micropolitan areas, and non-CBSA regions (the most rural). Notably, Asian, Black, Hispanic, and Native Hawaiian or Pacific Islander (NH/PI) populations live disproportionately in central metropolitan counties, relative to the U.S. total, while the American Indian or Alaska Native (AI/AN) population lives disproportionately in micropolitan counties or outside CBSAs entirely. The white population tracks closely to, but is slightly more rural than, the U.S. average, making up the majority of the population at a national level. These distributions alone imply that different populations are likely to have differing raw access to providers. By “raw access,” we mean the metric measured in this analysis of providers relative to population size, adjusted for distance, rather than a more complete measure of “realized access,” which might additionally address beneficiary cost limitations, availability of appointments, wait time for appointments, and other factors.
Figure 1: Racial distribution by type of county
| County type | Number of counties | American Indian or Alaska Native | Asian | Black | Hispanic | Native Hawaiian or Pacific Islander | White | Total |
|---|---|---|---|---|---|---|---|---|
| Metro central | 712 | 67% | 94% | 86% | 86% | 85% | 76% | 79% |
| Metro outlying | 467 | 6% | 4% | 5% | 5% | 4% | 8% | 7% |
| Micro | 656 | 14% | 2% | 5% | 5% | 9% | 10% | 8% |
| Non-CBSA | 1,300 | 13% | 1% | 3% | 3% | 2% | 6% | 5% |
| Nationwide | 3,135 | 100% | 100% | 100% | 100% | 100% | 100% | 100% |
Understanding the national healthcare provider distribution
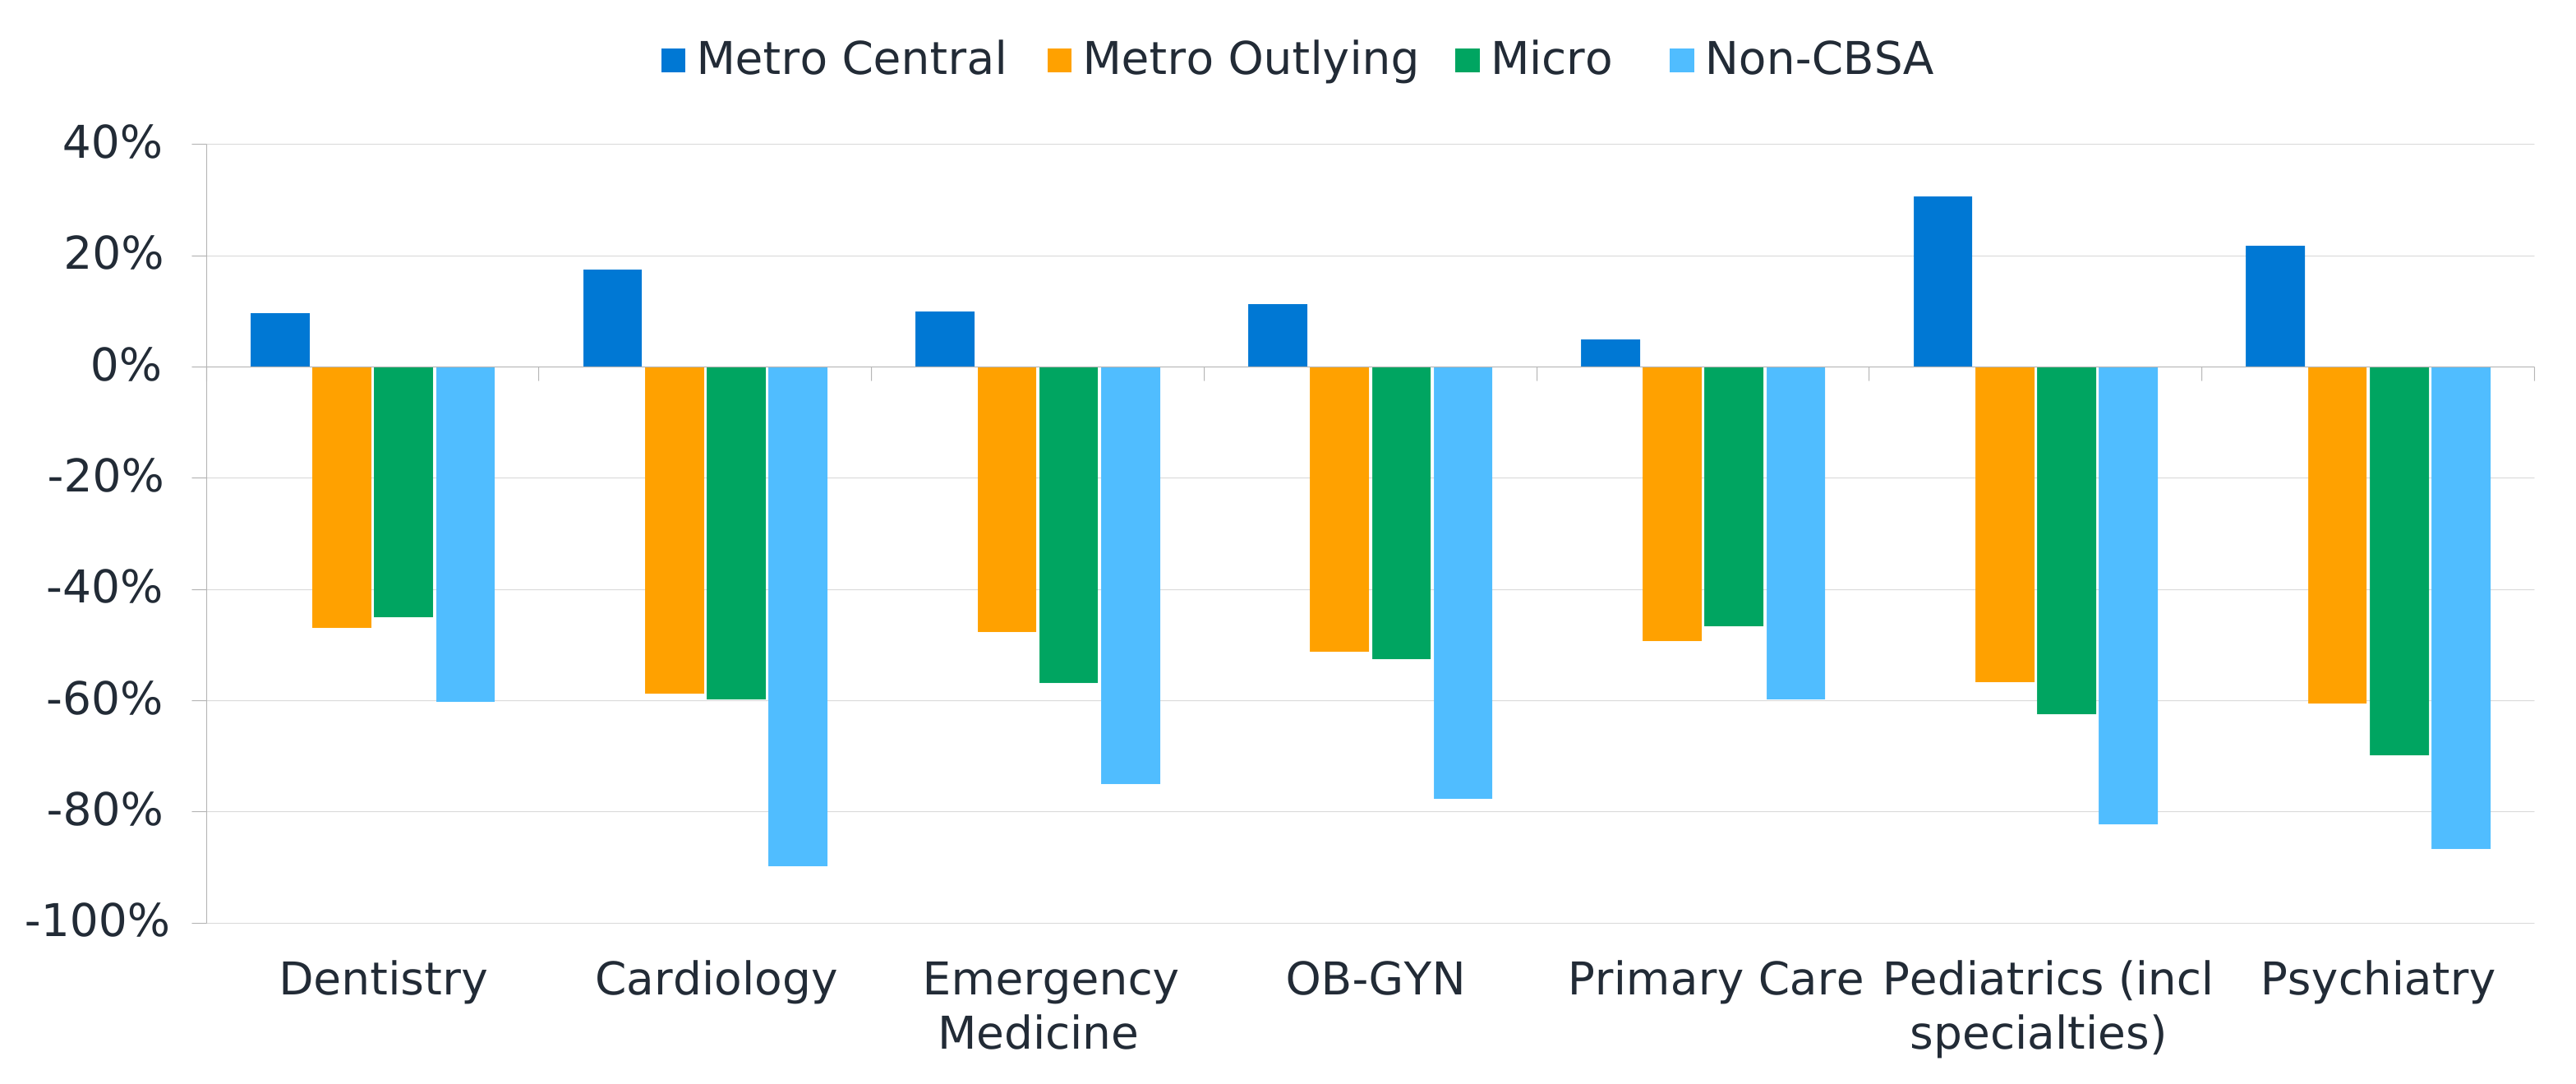
Physicians and other healthcare providers are also unevenly distributed across the U.S. for their own reasons. Much like the race-based breakdown of the population, more providers are present in the metro central counties around the country, while far fewer providers work in smaller cities or more rural regions. As an example, Figure 2 shows the relative presence of a handful of different specialties reported in the AHRF data by county type as described above. Unsurprisingly, specialists such as cardiologists, psychiatrists, and pediatricians are much more prevalent in metro central counties, with a rapid drop-off in the less urban areas. It is also notable that primary care providers and dentists show slightly less variation by area than most other specialties, which may be, in part, attributable to efforts by Indian Health Services and tribal health organizations, or rural health programs broadly , to make those services available to the AI/AN population and other rural residents.
It is also important to keep in mind that the results shown here are relative to national average provider accessibility, meaning that any existing deficiencies at the national level are replicated here.
Figure 2: Median provider distribution relative to nationwide average, total U.S. population
How do specialist provider and racial distributions interact?
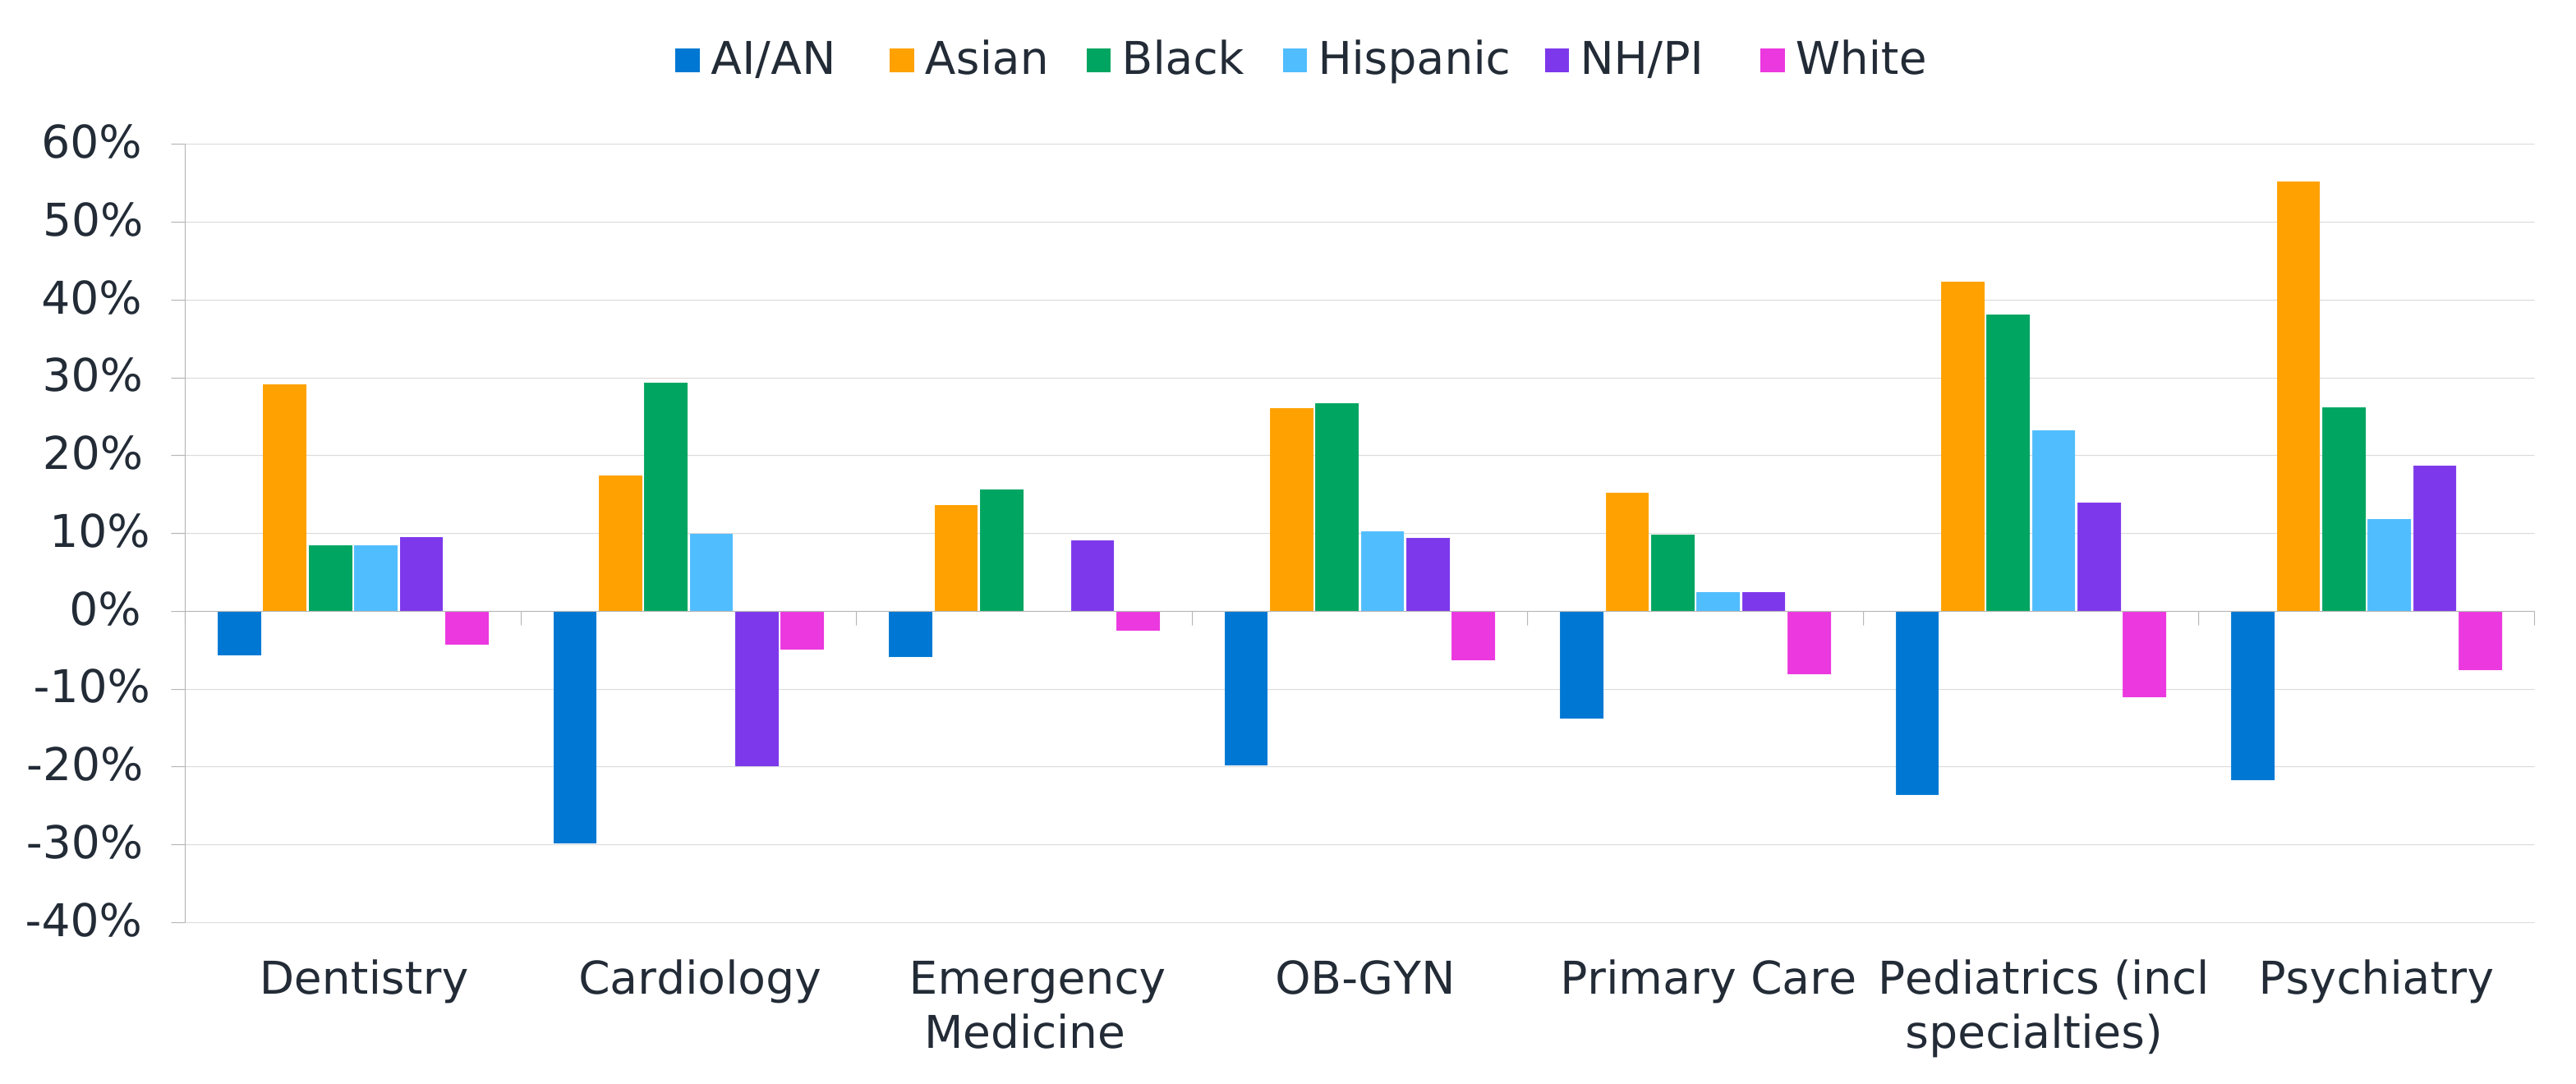
Understanding that fewer urban areas have smaller provider populations to begin with, and that the distribution by county type and race varies significantly, it is perhaps not surprising that different populations have substantially different raw access to the types of healthcare professionals shown here. Figure 3 demonstrates how these results aggregate, identifying significant baseline access challenges for the AI/AN population. Although some types of care, such as dental or emergency medicine, are relatively aligned with the national baseline for that group, others, such as cardiology, maternal healthcare, pediatrics, and mental health, are distinctly lacking. For example, the −20% value for AI/AN for OB-GYN means that the ratio of OB-GYN providers to patient population is 20% lower than the nationwide average. Similarly, the white population, skewing slightly more rural than the national average, also shows access challenges broadly.
Figure 3: Median provider distribution by race relative to total population values
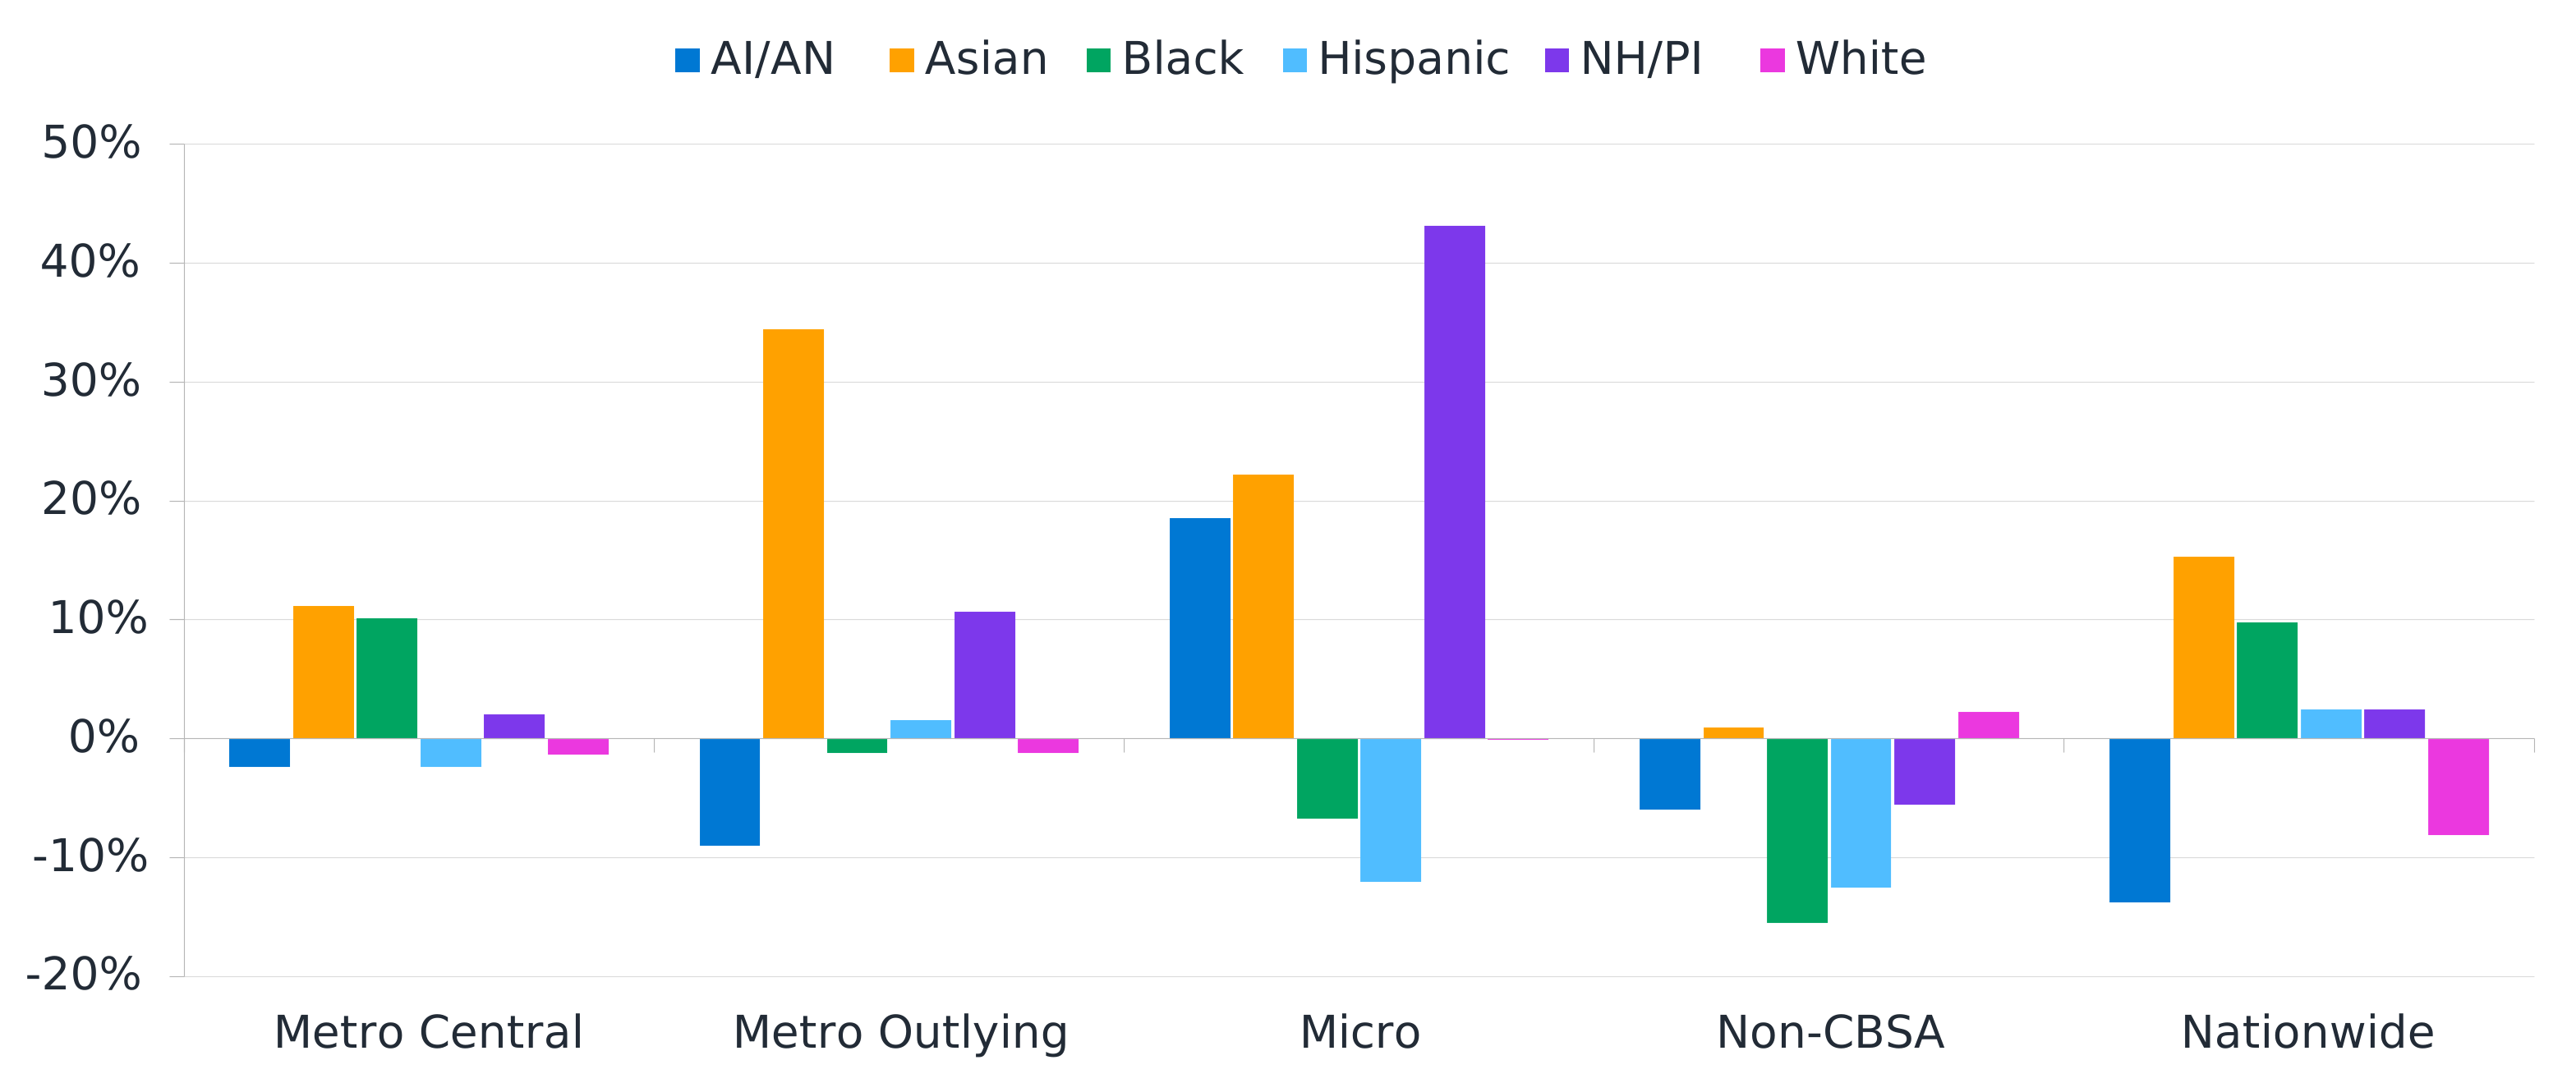
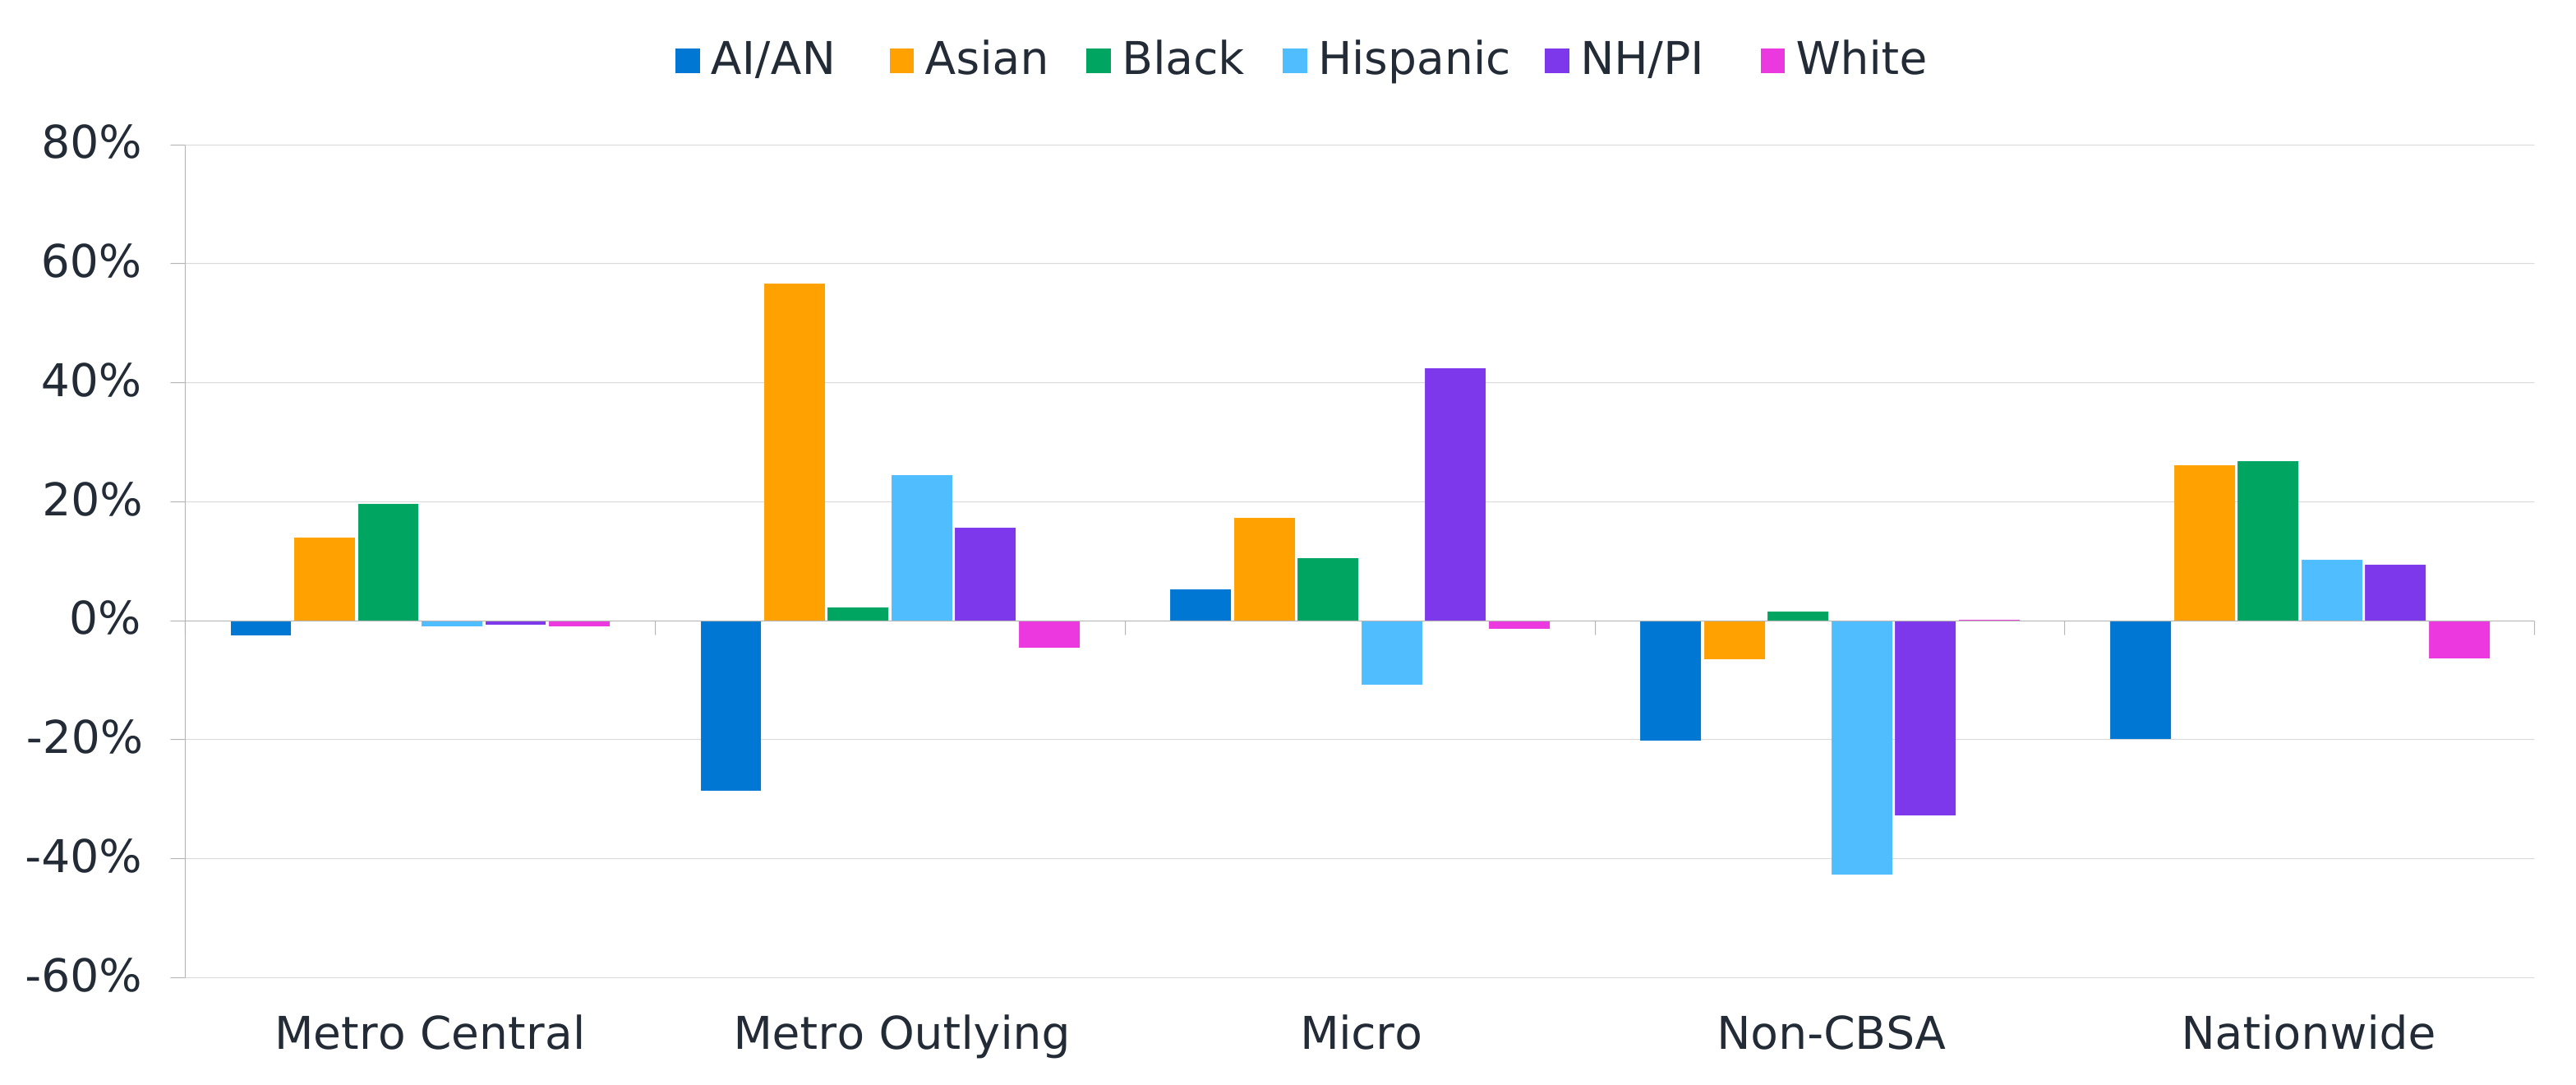
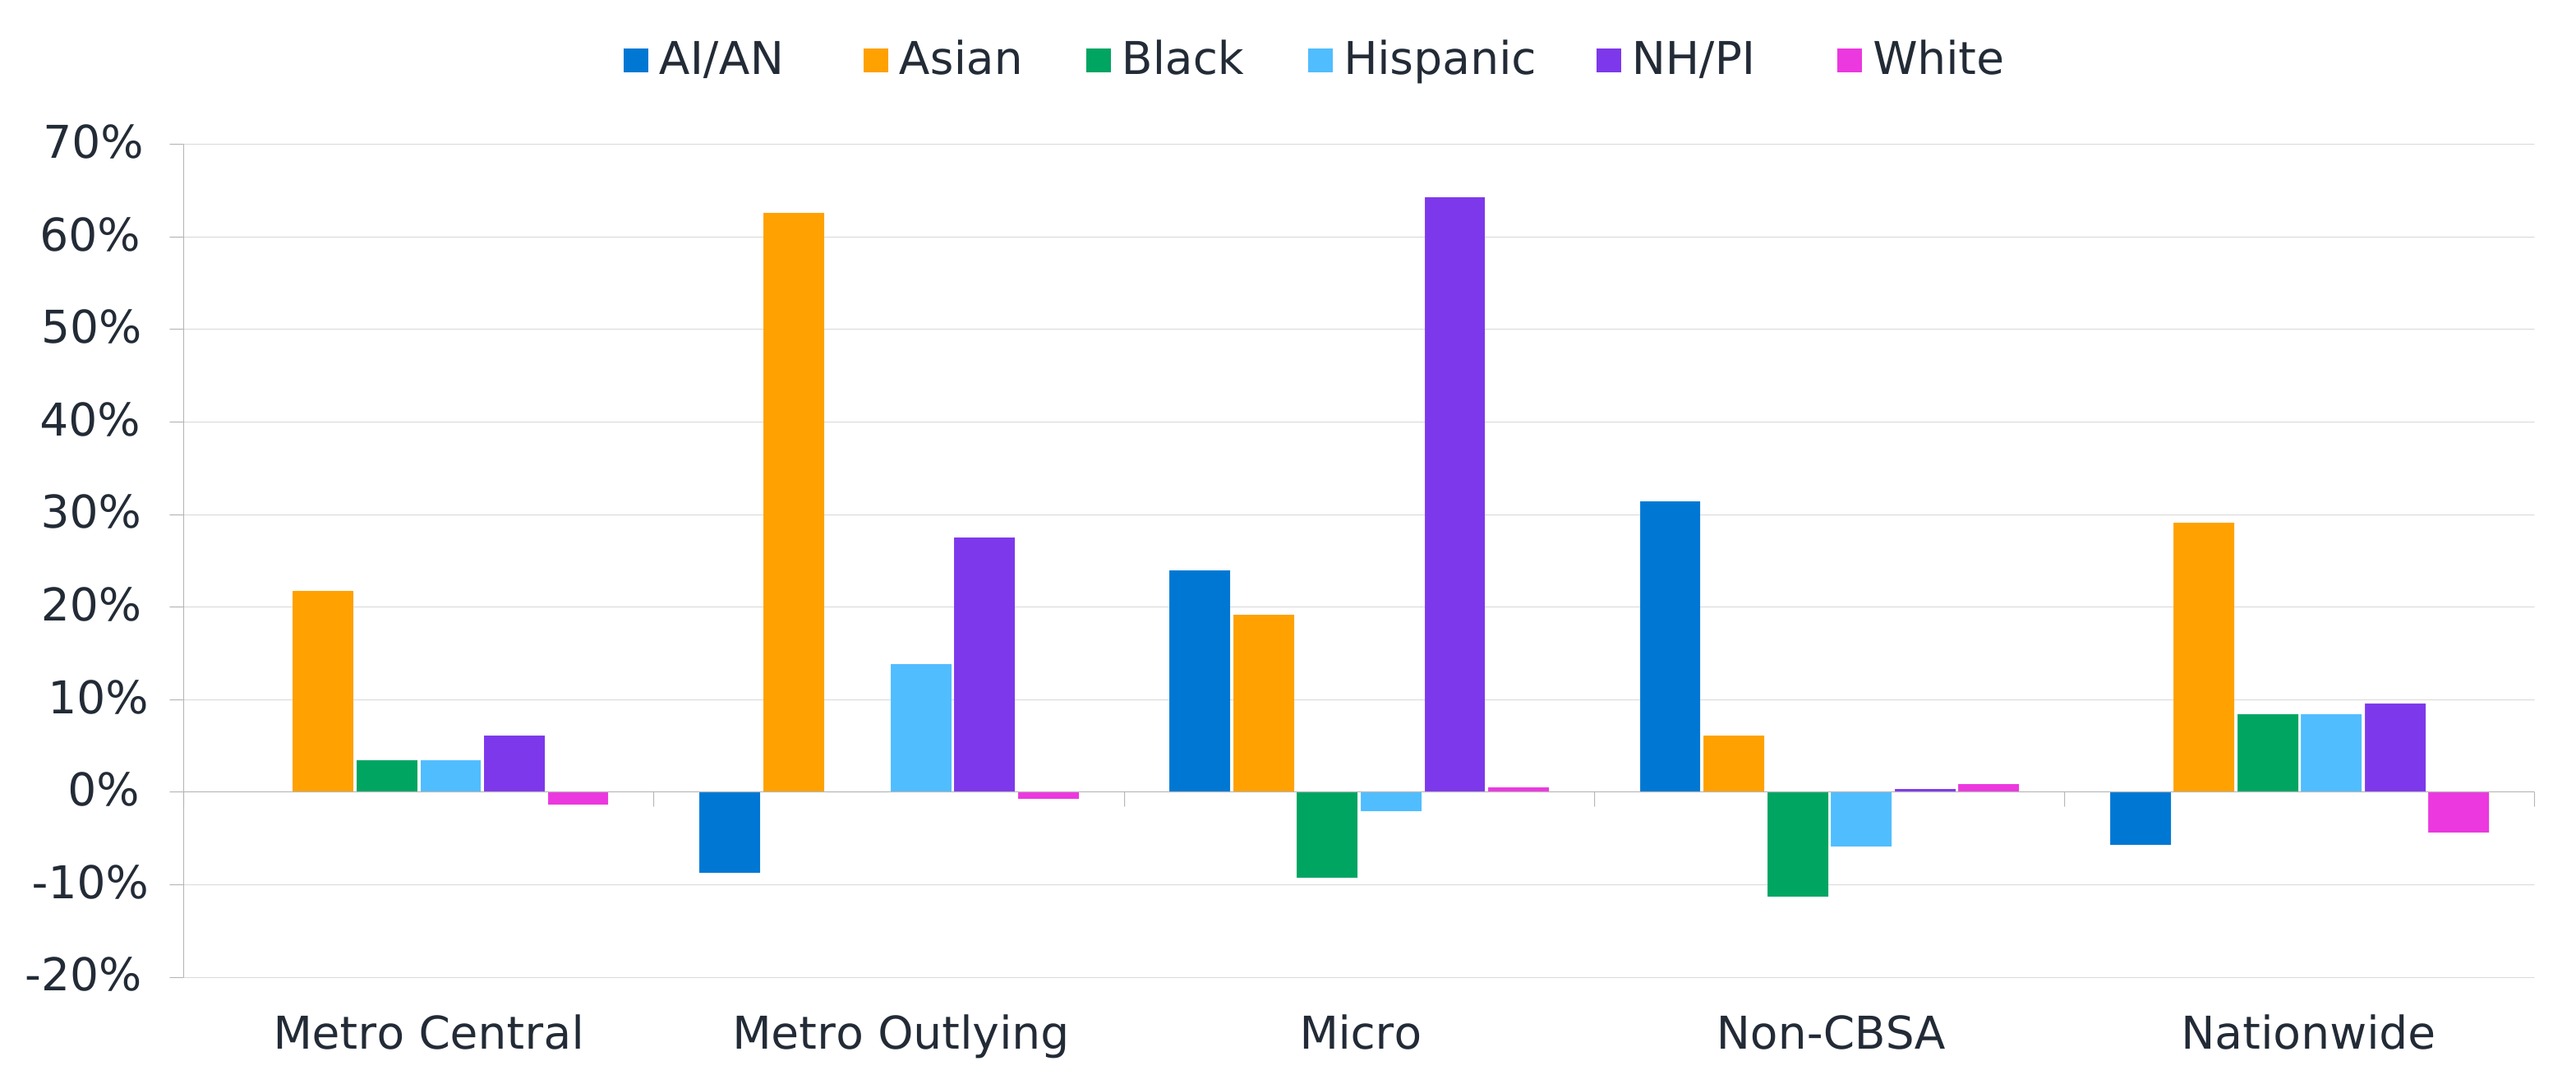
Although this initially appears to be driven entirely by differing racial prevalence by county type, variation in provider access exists even within similarly designated counties, as Figure 4, Figure 5, and Figure 6 illustrate for primary care, OB-GYNs, and dentists, respectively. In the primary care summary (Figure 4), we can see that Asian populations show particularly high access, whereas AI/AN populations generally have lower access. For OB-GYN access (Figure 5), the particular outlying metropolitan or non-CBSA counties where the AI/AN population lives appear to have a disproportionately low level of raw access compared to that for other racial groups. Notably, although many specialties show lower accessibility to the AI/AN population, dentists show a relatively higher level of access than most other specialties (Figure 6). The greater prevalence in non-CBSA regions is likely influenced by IHS and tribal organizations supported by IHS.
In each of these figures, some patterns observed by county designations are different from the pattern nationwide. For example, Figure 4 shows the AI/AN population having less primary care access compared to other racial groups for each county designation except for micropolitan areas, but that access is less than 10% lower than the median. However, nationwide, the AI/AN population has 14% lower primary care access. This pattern variation is caused by differences in the population distribution across the county designations by race. The AI/AN population skews more toward non-CBSA counties compared to other racial groups, and non-CBSA counties have lower access on average, which produces this pattern.
Actuarial implications of healthcare provider access gaps
The access gaps documented here are geographically structural, reflecting both where populations live based on myriad complex social factors and where providers choose to practice based on their own incentives and disincentives. This is crucial because standard remedies (Centers for Medicare and Medicaid Services [CMS] time-and-distance network adequacy standards, network expansion incentives, provider directories) operate within markets and cannot correct for the absence of a market or historical patterns of where people live. A Medicare Advantage or Marketplace plan can be compliant with network adequacy rules while still serving some sub-populations with materially lower provider access, particularly in the AI/AN, rural, and non-CBSA segments, as highlighted above.
These same populations are more likely to be under-coded in the CMS Hierarchical Condition Categories (CMS-HCC), Chronic Illness Disability Payment System (CDPS), and Department of Health and Human Services (HHS)-HCC risk score models because undiagnosed conditions do not contribute to risk scores. This would produce artificially low risk-adjusted revenue for the plans and providers serving them, leading to less incentive for investment in these areas in a self-perpetuating cycle. Likewise, limited access to providers means limited access to care and lower utilization. The combined effect of suppressed utilization relative to true need and suppressed coding hiding real morbidity creates a compounding bias against underserved geographies and populations in public perception, bid rates, risk transfer, and value-based care benchmarks. Recognizing this bias and addressing it explicitly, rather than assuming risk adjustment has done the work, is a crucial part of recognizing and enhancing the level of service for underserved populations.
Data and methodology
The underlying analysis of this paper relies on the 2023 AHRF workforce data sets, which include county-level data for provider and population counts, county or county-equivalent size, and county adjacency information. Provider counts are further broken down by specialty, and population counts are broken down by race. The State of Connecticut and all U.S. territories are excluded from this analysis due to reporting limitations in the AHRF data. Specifically, Connecticut’s ongoing change from county-reporting to planning region-reporting means that not all AHRF data is available under both frameworks. Similarly, for territories, the reported provider and population information is incomplete for purposes of this analysis.
The E2SFCA methodology is implemented based on catchment areas consisting of each county and its adjacent neighbors (including in other states). The purpose of the E2SFCA methodology is to adjust for the difficulty of accessing services via more remote providers. The farther a person needs to travel to reach a provider, the less accessible that provider is, so the accessibility measure is reduced as the distance between the population and the provider increases.
As implemented here, this methodology assumes counties are approximately circular, and both population and providers are concentrated near the center of the county. In actuality, neither of these is likely true in most cases, but both serve as simplifying assumptions to make the analysis more tractable. County size is determined by the square root of each county’s land area, with the Gaussian dampening function evaluated relative to the county sizes. This methodology does not take into consideration other factors that may impact travel time, such as actual driving distance, geographical barriers (e.g., mountain passes, bridges), or traffic speeds.
Once an estimate of the average provider accessibility is estimated for each county and for each provider specialty, results are summarized by race and county type, typically by looking at the median to moderate effect of outlier regions. The same provider accessibility measure is assumed for all people in a county regardless of race, but the distribution of race within a county impacts the weight placed on that county for each race. This produces different nationwide results by race that highlight how accessibility compares by race on average across the county. Note that the technical documentation on race for the AHRF data files indicates that the “Hispanic” category is also reported under any or all other groups, and so is duplicated across the other categories. It also suggests that the populations are based on the “race alone” definition, meaning that people self-reporting more than one race are categorized in a separate grouping not analyzed here. This is a common limitation of race-based reporting, where clear and consistent definitions are difficult to agree on and use across sources.
Caveats and limitations
The results presented here are based on historical data that has changed since it was captured and is expected to further change in the future. We relied upon the accuracy of data or information provided by AHRF and have not audited this information, although we have reviewed it for reasonableness. If the underlying data or information is inaccurate or incomplete, the results of our review may likewise be inaccurate or incomplete. Models used in the preparation of our analysis were developed and applied consistent with their intended use, including the E2SFCA technique developed by other experts. A Claude Opus 5.5 model was used to write some draft components of the code used in this analysis. Guidelines issued by the American Academy of Actuaries require actuaries to include their professional qualifications in all actuarial communications. We are members of the American Academy of Actuaries and meet the qualification standards for performing the analyses in this report.
1 Area Health Resource Files. (2026, January 29). Health Resources and Services Administration Data Warehouse. Retrieved October 27, 2026, from https://data.hrsa.gov/topics/health-workforce/nchwa/ahrf.
2 Health Resources and Services Administration. (n.d.). Find free or low-cost health services. Retrieved October 27, 2026, from https://www.hrsa.gov/.
3 Luo, W., & Qi Yi. (2009, December). An enhanced two-step floating catchment area (E2SFCA) method for measuring spatial accessibility to primary care physicians. Health & Place, 15(4), 1100–1107. Retrieved October 27, 2026, from https://www.sciencedirect.com/science/article/abs/pii/S1353829209000574.
4 State of the U.S. Health Care Workforce, 2025. (2025, December). Health Resources and Services Administration. Retrieved October 27, 2026, from https://bhw.hrsa.gov/sites/default/files/bureau-health-workforce/data-research/State-of-US-Health-Care-Workforce-2025.pdf.
5 Shaw, M.L. (2024, September 13). 5 specialty care shortages in rural communities. AJMC. Retrieved October 27, 2026, from https://www.ajmc.com/view/5-specialty-care-shortages-in-rural-communities.
6 Balasubramanian, S. (2025, November 30). The healthcare workforce shortage is growing; states are rushing to fix it. Forbes. Retrieved October 27, 2026, from https://www.forbes.com/sites/saibala/2025/11/30/the-healthcare-workforce-shortage-is-growing-states-are-rushing-to-fix-it/.